From the paper
Why can a polariton line be narrower than either bare ingredient suggests?
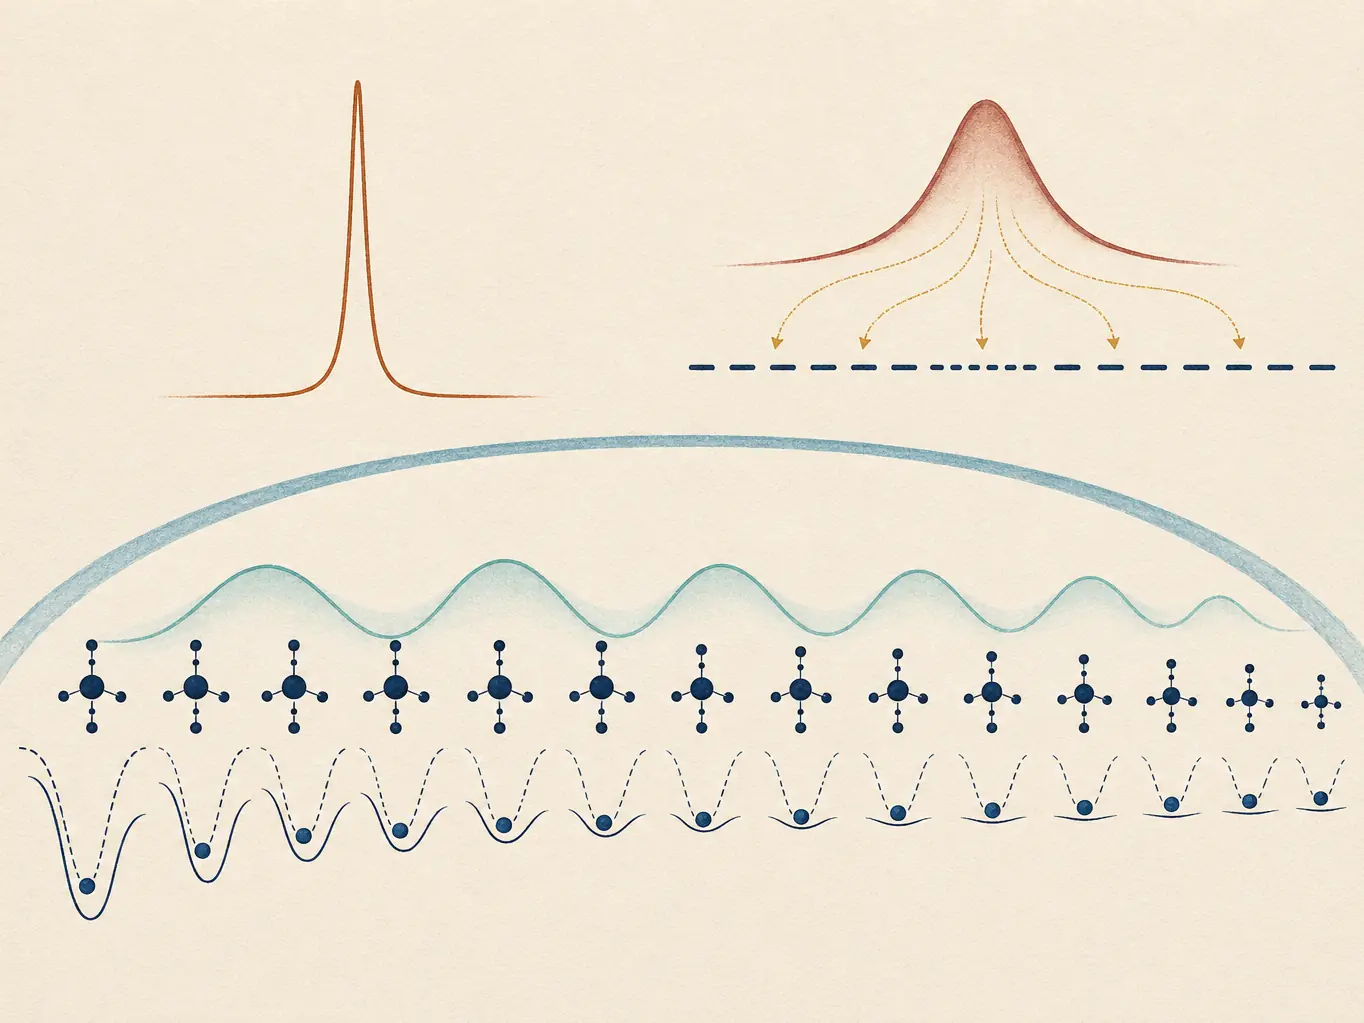
A localized molecular excitation displaces one local phonon environment. A collective bright excitation repeatedly exchanges with the cavity photon and distributes its molecular weight over $N$ independent environments. Each local bath therefore experiences a much smaller displacement. The paper shows that this collective polaron decoupling appears in a minimal single-mode Holstein–Tavis–Cummings model and explains both line narrowing and its dependence on $N$.
From the paper
HTC system, independent baths, and cavity loss
$N$ identical two-level molecules couple equally to one cavity mode under the rotating-wave and long-wavelength approximations. Each molecule has its own identical harmonic environment, while photon loss is represented by a Lindblad channel. One collective bright state hybridizes with the photon to make upper and lower polaritons; $N-1$ combinations remain dark.
- Local excitationOne bath experiences the full molecular displacement.
- Collective bright stateThe displacement amplitude on each molecule scales down with delocalization.
- Spectral lineReduced bath coupling narrows the matter contribution until cavity loss sets a floor.
From the paper
Fast and slow bath limits
At resonance the effective polariton reorganization energy is
For a slow bath the line is approximately Gaussian and its width scales as $\sqrt{\lambda_N}\propto N^{-1/2}$. For a fast bath it is Lorentzian and the bath contribution scales as $\lambda_N\propto N^{-1}$. The upper polariton is generally broader because downhill phonon-assisted transfer into the lower polariton and the dark manifold adds decay channels.
Simplified educational example
A linewidth scaling estimate
At resonance, use $\Gamma_c=44.15$ meV and a bare exciton width $\Gamma_{\mathrm{ex}}=76.5$ meV. The fast-bath estimate $\Gamma_{LP}\approx\Gamma_c/2+\Gamma_{\mathrm{ex}}/(2N)$ gives 60.33 meV at $N=1$, 31.64 meV at $N=4$, and 26.86 meV at $N=8$.
Python scaling plot
import numpy as np
import matplotlib.pyplot as plt

Gamma_c, Gamma_ex = 44.15, 76.5  # meV
N = np.arange(1, 65)
fast = Gamma_c/2 + Gamma_ex/(2*N)
slow = Gamma_c/2 + Gamma_ex/(2*np.sqrt(N))
plt.plot(N, fast, label="fast bath")
plt.plot(N, slow, "--", label="slow bath")
plt.axhline(Gamma_c/2, color="0.4", label="cavity floor")
plt.xlabel("N"); plt.ylabel("linewidth (meV)")
plt.legend(); plt.show()
From the paper
Reported numerical conclusions
- HEOM and the analytic theory show narrowing with increasing $N$ and a crossover between slow- and fast-bath scaling.
- Detuning changes the exciton/photon weights and therefore the balance between phonon broadening and cavity loss.
- The lower polariton follows the collective narrowing trend, while the upper branch receives additional phonon-mediated broadening into lower and dark states.
- A single-mode cavity is sufficient to reproduce the main qualitative signatures without invoking in-plane cavity dispersion.
Scope and limitations
What the minimal model leaves out
- Identical aligned molecules, independent identical baths, one cavity mode, and no static disorder.
- A rotating-wave HTC model rather than a full ultrastrong-coupling Pauli–Fierz Hamiltonian.
- The analytic linewidth formulas depend on bath limits and Fermi-golden-rule assumptions.
- Upper-polariton broadening depends on the sampled bath spectrum and dark-state density.
- Real experiments may include multimode dispersion, correlated disorder, and excitonic interactions.