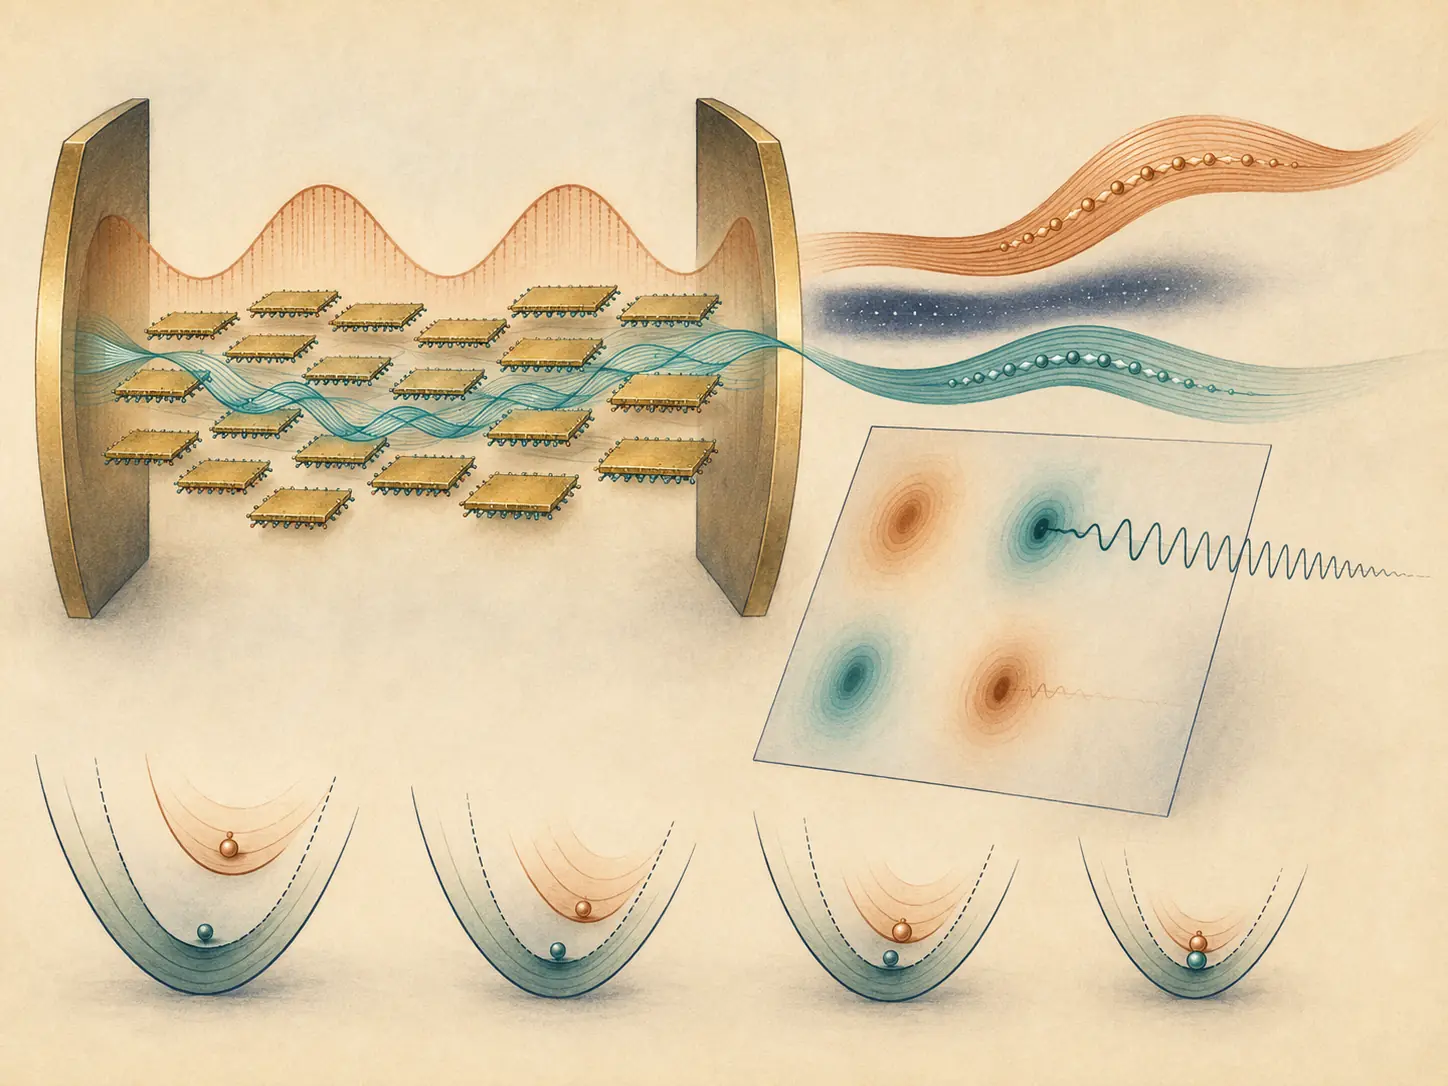
From the paper
Can collective coupling protect room-temperature polariton coherence?
Molecular vibrations and cavity photon leakage normally shorten electronic coherence. This work asks whether collective exciton-cavity coupling can protect coherence between upper and lower polaritons and whether 2DES can reveal both the longer coherence and the accompanying suppression of exciton-phonon coupling. CdSe nanoplatelets in a high-quality Fabry-Perot cavity are proposed as a favorable experimental platform.
From the paper
Bright, dark, and polariton states
The Holstein-Tavis-Cummings model contains $N$ two-level excitons, one cavity mode, and one independent harmonic bath per exciton. At resonance the bright-state bath displacement is suppressed, giving
That diagonal decoupling competes with phonon-assisted upper-polariton transfer into the $N-1$ dark states and with cavity leakage.
- Collective hybridizationOne bright exciton and one photon form LP and UP.
- Reduced displacementThe bright-state reorganization energy decreases as $1/(4N)$.
- Residual decayUP-to-dark transfer and cavity loss limit coherence.
From the paper
How the 2D spectrum measures both effects
The L-PLDM calculation evaluates rephasing and nonrephasing ground-state bleach, stimulated-emission, and excited-state-absorption pathways through the double-excitation manifold. The upper-lower cross-peak amplitude oscillates during population time,
The decay of this oscillation diagnoses polaritonic coherence. Separately, the nodal-line slope through the lower-polariton diagonal feature tracks spectral diffusion: a flatter line indicates stronger polaron decoupling and weaker frequency memory from the bath.
Simplified educational example
Estimate the collective scales for four molecules
Take $N=4$, $\hbar g_c=24.8$ meV, molecular $\lambda=6.2$ meV, and loss width $\Gamma=10$ meV. Then $\hbar\Omega_R=99.2$ meV, $\lambda_N=0.3875$ meV, the cavity lifetime scale is $\hbar/\Gamma\approx65.8$ fs, and the full beat period is about 41.7 fs.
Python scale calculation
import numpy as np

hbar = 658.2119569  # meV fs
N, gc = 4, 24.8
lambda_mol, Gamma = 6.2, 10.0
Omega_E = 2*np.sqrt(N)*gc
lambda_pol = lambda_mol/(4*N)
period = 2*np.pi*hbar/Omega_E
print(Omega_E, lambda_pol, hbar/Gamma, period)
From the paper
Reported predictions
- The fitted cross-peak decay parameter rises from about 74 to 100 to 122 fs as collective coupling increases in the reported series; the observable coherence is discussed as persisting to roughly 200 fs.
- Protection is attributed to reduced bright-state phonon coupling and a phonon bottleneck as the UP-dark gap moves through the bath spectrum.
- The lower-polariton nodal line becomes very flat at the strongest coupling, indicating suppressed spectral diffusion.
- Rephasing pathways dominate the oscillatory cross peaks, while imperfect GSB/ESA cancellation permits weaker nonrephasing cross peaks.
Scope and source cautions
What should not be overinterpreted
- The production calculations use $N=2,4,8$ and infer behavior of larger experimental ensembles at fixed collective coupling.
- Static energetic disorder is omitted, although it may dominate organic polariton broadening.
- L-PLDM and Markovian Lindblad loss are approximations, and the work reports theoretical predictions rather than measured spectra.
- The supplied sources contain a parameter inconsistency: the main paper lists $\lambda=50$ cm$^{-1}$ and characteristic bath frequency 18 cm$^{-1}$, while the SI appears to interchange them. The values should be author-confirmed before a parameter-reproduction notebook is added.